7 KPIs for Scaling Meta Ads Profitably
Turn the strategy into creatives
Create Meta ads for your product
Paste your product page. ADEN'S LAB turns the offer, audience, and positioning into complete ready-to-use Meta static ads.
Free to try No prompt writing

Scaling Meta ads can generate significant profits, but only if you focus on the right metrics. Ignoring key performance indicators (KPIs) like ROAS, CPA, CTR, Frequency, CPM, CVR, and CPMr can lead to wasted ad spend and poor results. These metrics provide the data needed to make smarter decisions about when to scale, pause, or adjust campaigns. For example:
- ROAS: Measures revenue generated per dollar spent; aim for at least 3x for healthy scaling.
- CPA: Tracks the cost of acquiring customers; keep it stable to maintain profitability.
- CTR: Indicates ad engagement; higher rates suggest effective creative and targeting.
- Frequency: Monitors how often users see your ads; high frequency signals ad fatigue.
- CPM: Tracks costs per 1,000 impressions; rising CPMs can indicate audience saturation.
- CVR: Measures how well clicks convert into actions like purchases; low CVR often points to landing page issues.
- CPMr: Focuses on the cost of reaching unique users; high CPMr suggests audience exhaustion.
My Meta Ads Optimization Sheet for Scaling Ecom Profitably

Put the playbook to work
Apply this playbook to your page
Paste your website and the Lab will turn the strategy you are reading into a ready-to-test ads.
Free to try No prompt writing
1. ROAS (Return on Ad Spend)
ROAS (Return on Ad Spend) is a metric that tells you how much revenue you generate for every dollar spent on advertising. To calculate it, divide the revenue from your ad campaign by the campaign's cost. For instance, if you spend $1,000 on ads and bring in $3,800 in revenue, your ROAS is 3.8x. On average, Meta campaigns across Facebook and Instagram deliver a ROAS of around 3.8x.
However, ROAS alone doesn’t guarantee profitability. A 4x ROAS might look impressive, but if your profit margin is only 20%, you’d actually need a 5.0x ROAS just to break even. To find your break-even ROAS, divide 1 by your profit margin. Falling below this number means your ad spend isn’t covering your costs.
When it comes to scaling, a ROAS of 3x or higher is generally a good indicator. Benchmarks for 2026 suggest a healthy range between 2.79x and 3.61x. In early 2025, the median ROAS across advertisers was roughly 2.19x. Rather than reacting to daily fluctuations, focus on consistent ROAS trends over at least 7 days. A strong ROAS suggests that Meta’s algorithm has pinpointed a high-value audience, making it a good time to consider increasing your budget.
Be cautious when interpreting platform-reported ROAS, as it might not reflect actual profitability. Meta’s default attribution setting (7-day click/1-day view) can inflate ROAS by including passive exposures. Always cross-check these numbers with backend data, factoring in costs like COGS, shipping, and fulfillment, to confirm your campaign is genuinely profitable. When scaling, increase budgets by 20–30% every 3–4 days to avoid disrupting the learning phase.
Here’s a quick guide to interpreting ROAS and scaling decisions:
| ROAS Level | Performance Interpretation | Scaling Action |
|---|---|---|
| Below 2x | Likely unprofitable for most campaigns | Refine creative and targeting before increasing spend. |
| 2x - 4x | Healthy, within standard benchmarks | Gradually scale budgets by 20–30%. |
| 4x - 8x | Strong performance | Scale aggressively and explore new audience segments. |
| 8x+ | Outstanding results | Maximize reach and expand creative assets to avoid fatigue. |
For a balanced approach, monitor ROAS alongside other metrics like CPA and CTR. Ensure ROAS trends remain stable for at least 7 days before scaling further.
2. CPA (Cost Per Acquisition)
CPA (Cost Per Acquisition) tells you how much it costs to acquire a customer or lead. You calculate it by dividing your total ad spend by the number of conversions. For example, if you spend $500 on ads and secure 20 purchases, your CPA is $25. This metric is crucial because it directly ties your ad spend to profit margins and the lifetime value of your customers.
When setting a target CPA, focus on your business's specific economics rather than relying solely on industry averages. In 2026, average CPAs for e-commerce purchases range between $25 and $50, with top performers managing to stay under $20. For SaaS trial signups, CPAs typically fall between $50 and $200. B2B lead generation hovers between $15 and $50, while app installs usually cost between $2 and $8. However, a CPA that works for one business might not work for another - it all depends on your profit margins and how quickly you recover your costs.
To keep your CPA under control, monitor trends over a seven-day period and aim to keep daily fluctuations within 20%. If your CPA starts climbing, it could mean your audience is saturated, your ad creatives are no longer engaging, or auction competition has intensified. For prospecting campaigns, pay attention to your ad frequency. When it exceeds 3, it’s a sign that your audience is seeing your ads too often. To avoid this, maintain a collection of 5–10 effective ad variations. This practice, often called creative scaling system can help prevent audience fatigue and keep your CPA steady.
Automated rules can also help you catch CPA spikes early. For example, you can configure Meta to notify you if your CPA exceeds your target by 20% for two days in a row. For more immediate responses, set up kill switches to pause campaigns if your CPA exceeds your target by 50% or if your ROAS drops below break-even for 48 hours. If a campaign spends 2–3 times your target CPA without generating any conversions, it’s worth checking for issues with your Meta Pixel or Conversions API. These measures can help you maintain CPA stability, especially as you scale.
When CPA starts to rise, creative fatigue is often the culprit. Instead of just tweaking your targeting, focus on refreshing your ad creatives to keep your audience engaged. Tools like ADEN'S LAB make this easier by quickly generating high-performing static Meta ads. With prices starting as low as $0.90 per ad, you can replace underperforming creatives before they drag down your CPA. From here, you can explore how click engagement plays a role in refining your scaling strategies.
3. CTR (Click-Through Rate)
CTR (Click-Through Rate) measures how often people click on your ad after seeing it. To calculate it, divide the number of link clicks by the number of impressions. This metric helps you determine if your ad is effective at grabbing attention and stopping users mid-scroll. As of 2026, the average CTR for Meta ads across industries is about 1.49%. However, this varies by placement: Facebook Feed averages around 0.90%, while Reels - designed more for entertainment - see a lower CTR of roughly 0.35%.
What qualifies as a "good" CTR depends on your campaign goals. For awareness campaigns aimed at driving traffic to blog posts, a CTR between 1.5% and 2% is considered solid. For direct response campaigns, you’ll want a CTR above 2%, with anything over 3–4% being exceptional. Still, a high CTR doesn’t always mean your campaign is profitable. If your CTR is strong but your conversion rate is low, the issue likely lies with your landing page rather than the ad itself. Ultimately, a high CTR only matters if it leads to conversions.
When CTR starts to decline, ad fatigue is often the culprit. Máté Hunyor from Wupscale notes:
"The biggest effect on the CTR is coming from the creative side, so basically the static image, or the video part of your Meta ad".
Users tend to scroll past ads that feel too much like sponsored content. To combat this, it’s smart to rotate through 5–10 proven ad variations to keep your campaigns fresh.
For video ads, the Thumb Stop Rate is another valuable metric to monitor. This measures the percentage of viewers who watch the first 3 seconds of your video. High-performing video ads typically achieve a Thumb Stop Rate of 25%. This metric helps you identify strong creatives early on, even before you gather significant conversion data. If your Thumb Stop Rate is low, it’s a sign your opening hook needs work. Similarly, if your CTR is high but conversions are lagging, the problem likely lies with your landing page.
To keep your creative fresh and maintain engagement, consistent A/B testing and updates are key. Platforms like ADEN'S LAB can simplify this process by automating ad creation. They allow you to generate dozens of static Meta ads weekly, optimized for scroll-stopping performance, with costs starting at just $0.90 per ad. This ensures you can refresh your creative library regularly, avoiding ad fatigue and keeping CTRs strong. Pairing this approach with regular performance monitoring will help create scalable, profitable campaigns. Keeping track of how often your audience sees your ads is another important factor in maintaining engagement.
4. Frequency
Frequency measures how often a single person sees your ad, acting as a safeguard against ad fatigue. When frequency gets too high, conversion rates tend to drop, leading to a higher Cost Per Acquisition (CPA) and a lower Return on Ad Spend (ROAS).
For prospecting campaigns, aim to keep frequency below 2–3. Frequencies above 3–4 often indicate fatigue, especially if you notice declining Click-Through Rates (CTRs) or rising Cost Per Mille (CPMs). On the other hand, a frequency under 2.5 typically means your creative is still resonating and budgets can be scaled effectively using an AI budget method. Retargeting campaigns, however, can handle higher frequencies - around 5–7 - due to the audience's prior familiarity with your brand.
High frequency can also point to audience saturation, where the same users repeatedly see your ad instead of reaching new prospects. Ravi Abuvala, CEO of Scaling With Systems, highlights this issue:
"When a small group of people sees your ads repeatedly, the probability of conversions decreases after a certain number".
Spotting high frequency is crucial because it signals when adjustments are needed. Managing frequency helps maintain profitability and strong ROAS. If you notice performance slipping as frequency rises, you have two key strategies to consider:
- Refresh your creative: Modify elements like the hook, call-to-action, colors, or format. For example, switch from a static image to a video. If you're short on creative ideas, ADEN'S LAB offers a solution by generating dozens of fresh static Meta ads weekly for just $0.90 per ad, helping to avoid creative bottlenecks.
- Horizontal scaling: Duplicate successful ad sets and target broader or new audience segments. Gradually increase budgets by 20–30% every 3–5 days to keep frequency stable while staying within Meta's learning phase.
5. CPM (Cost Per Mille)
CPM represents the cost for 1,000 impressions. In 2026, average CPMs range between $8.50 and $14.00. This metric often reflects the level of competition in ad auctions - rising CPMs typically indicate increased competition or audience saturation.
As campaigns scale, keeping an eye on CPM is critical for maintaining profitability. Higher CPMs mean higher baseline costs for reaching your audience, which can directly affect your bottom line. For instance, if your conversion rate remains steady while CPM increases, your CPA (Cost Per Acquisition) will naturally rise. During the Q4 holiday season, CPMs can spike by 20% to 40%, posing challenges to profit margins. However, CPM alone doesn’t tell the full story. If your targeting drives conversions within your target CPA, even a higher CPM can be justified. On the other hand, low CPMs that fail to produce sales are essentially wasted spend. Meta’s auction system rewards high-quality ads with lower costs, making ad quality a key factor in CPM management.
To manage CPM effectively while scaling, focus on improving your Quality, Engagement Rate, and Conversion Rate rankings, as these can help reduce auction costs. If your CPM rises above benchmarks and your ad frequency exceeds 3–4 in prospecting campaigns, it’s time to refresh your creatives or broaden your interest-based targeting. Regularly monitoring metrics like CPM and ROAS (Return on Ad Spend) can make a significant difference - businesses that actively track these metrics see an average performance improvement of 34% compared to those who check sporadically.
Struggling to keep up with the demand for fresh creatives? Rising CPMs often require AI-generated ad variations to maintain profitability at scale. Services like ADEN'S LAB can help by generating dozens of static Meta ads weekly for just $0.90 per ad. Staying on top of CPM trends and creative performance is essential for making smarter decisions as you scale your campaigns.
6. CVR (Conversion Rate)
CVR, or Conversion Rate, shows the percentage of users who complete a desired action - like making a purchase or signing up - after clicking on your ad. To calculate it, divide the number of conversions by the total clicks, then multiply by 100. This metric is a key indicator of whether your ad spend is delivering actual results. A high CVR means your messaging and landing page are working well together, while a low CVR suggests wasted ad spend.
Before scaling, ensure your CVR is stable or improving. Meta’s algorithm works best when your campaign generates at least 50 conversion events per week. If you’re not consistently hitting about 8 to 10 conversions per day, scaling might be premature. For new campaigns, expect CPAs (Cost Per Acquisition) to fluctuate between 2x and 5x your target during the first couple of days. Let the campaign run for 3–7 days to achieve consistent performance before scaling. This period of stability ensures that CVR gains complement improvements in other metrics like CPA and CTR.
When CTR (Click-Through Rate) is high but CVR is low, the issue often lies with your landing page. Problems like slow load times, poor mobile optimization, or a mismatch between your ad’s promise and the landing page content can hurt conversions. On the flip side, if CVR is high but CTR is low, your targeting might be too narrow, or your creative isn’t engaging enough. Breaking down CVR into smaller steps, like micro-conversions, can help pinpoint where users drop off. For example, a healthy Add to Cart (ATC) to Link Click ratio is around 15%, while the Purchase to ATC ratio should fall between 30% and 50%.
Accurate tracking is essential to understanding CVR. Use both the Meta Pixel and Conversions API (CAPI) to gather data, even from users with browser restrictions or privacy opt-outs. Without proper tracking, you’re essentially guessing. Set clear stop-loss rules to manage underperforming campaigns: pause ad sets that spend $10 without a conversion or campaigns that exhaust their daily budget without results. Keeping CVR strong is crucial for scaling efforts and works hand-in-hand with creative updates and audience engagement.
To maintain CVR during scaling, regularly automate Meta ad production to refresh your creatives. Signs of creative fatigue, like declining CTR and rising CPM, often lead to CVR drops. Tools like ADEN'S LAB can help by producing dozens of static Meta ads weekly for as little as $0.90 per ad, giving you the volume needed to combat fatigue and keep conversions steady. A robust CVR, combined with solid CTR and controlled CPM, is the foundation of profitable scaling.
7. CPMr (Cost Per Mille Reach)
CPMr, or Cost Per Mille Reach, is a vital metric for refining your scaling strategy for Meta ads. It measures the cost of reaching 1,000 unique users, offering a distinct perspective compared to CPM, which tracks the cost per 1,000 impressions. To calculate CPMr, use this formula: (Total Spend ÷ Reach) × 1,000. This metric ensures you're efficiently expanding your audience rather than wasting your budget by repeatedly targeting the same individuals.
A low CPMr means you're effectively reaching new users at a reasonable cost. On the flip side, a high CPMr often signals audience fatigue or challenges in finding fresh users. For prospecting campaigns, if your frequency surpasses 3, it likely indicates audience saturation, which can lead to a rising CPMr. As Shifa Islam from Marketing Lab notes, signs like low CAC, low CPIR, and strong reach from fresh accounts suggest it's the right time to scale. However, if CPMr increases while CPM remains stable, it’s a clear sign that your audience pool is exhausted.
To reduce a high CPMr, consider these strategies:
- Broaden your targeting by loosening restrictions or expanding Lookalike audiences from 1% to 3% or even 5%.
- Use exclusion lists to avoid re-targeting past purchasers and focus on new users.
- If your audience is small or you're operating in a competitive niche, be prepared for higher CPMr values.
- Leverage Advantage+ placements to let Meta optimize unique reach across various ad formats like Feed, Stories, and Reels.
Regularly refreshing your ad creatives is also essential for keeping CPMr in check. When frequency exceeds 3–4 and CTR drops, ad fatigue can drive auction costs higher. Tools like ADEN'S LAB can help you quickly generate fresh static ads to combat this issue.
Integrating CPMr into your KPI analysis is as important as tracking ROAS and CPA. When used alongside metrics like frequency, CPM, and CVR, CPMr provides a deeper understanding of your campaign's efficiency. For instance, if CPMr rises while ROAS falls, it's a signal to pause and refresh your creative before scaling further. Monitoring CPMr ensures you’re not overspending on exhausted audiences, paving the way for smarter, more profitable growth.
KPI Benchmarks and Action Thresholds
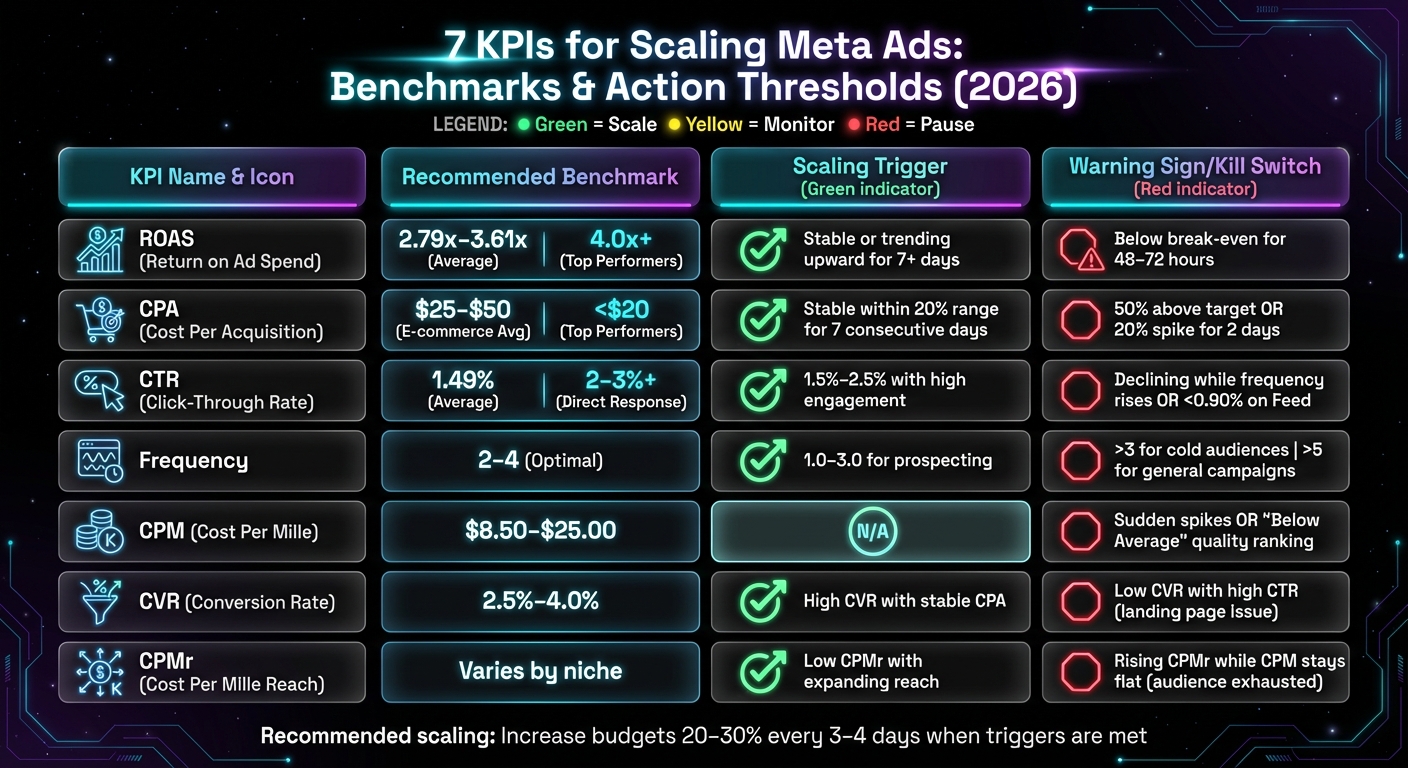
Meta Ads KPI Benchmarks and Action Thresholds for Scaling
Understanding when to scale or pause campaigns based on key performance indicators (KPIs) is essential for maintaining profitability. The table below outlines recommended benchmarks, triggers for scaling, and warning signs for each metric, based on 2026 performance data.
| KPI | Recommended Benchmark | Scaling Trigger | Warning Sign / Kill Switch |
|---|---|---|---|
| ROAS | 2.79x–3.61x (Avg), 4.0x+ (Top Performers) | Stable or trending upward for 7+ days | Below break-even for 48–72 hours |
| CPA | $25–$50 (E-commerce Avg), <$20 (Top Performers) | Stable within 20% range for 7 consecutive days | 50% above target or 20% spike for 2 days |
| CTR | 1.49% (Avg), 2–3%+ (Direct Response) | 1.5%–2.5% with high engagement | Declining while frequency rises or <0.90% on Feed |
| Frequency | 2–4 (Optimal) | 1.0–3.0 for prospecting | >3 for cold audiences, >5 for general campaigns |
| CPM | $8.50–$25.00 | N/A | Sudden spikes or "Below Average" quality ranking |
| CVR | 2.5%–4.0% | High CVR with stable CPA | Low CVR with high CTR (landing page issue) |
| CPMr | Varies by niche | Low CPMr with expanding reach | Rising CPMr while CPM stays flat (audience exhausted) |
This table acts as a quick-reference guide to help align scaling decisions with real-time performance metrics.
To ensure smooth scaling, campaigns should demonstrate consistent performance for at least seven days, with CPA staying within a 20% variance. When scaling, increase budgets incrementally - by 20–30% every 3–4 days - to avoid triggering a learning phase reset.
Automated kill switches are a must-have to prevent small issues from snowballing into major problems. Campaigns should be paused immediately if:
- CPA exceeds your target by 50%.
- ROAS drops below break-even for 48–72 hours.
- Frequency climbs above 5.
Creative fatigue is another factor that can quickly impact performance. Combat this by maintaining a rotating library of 5–10 proven ad variations. Tools like ADEN'S LAB can help generate fresh static ads quickly, eliminating delays from designers or agencies.
Conclusion
Scaling Meta ads effectively means keeping a close eye on the right metrics to avoid costly mistakes. The seven KPIs discussed in this article provide a solid framework: ROAS ensures profitability, CPA monitors customer acquisition costs, CTR evaluates creative engagement, Frequency alerts you to ad saturation, CPM assesses bidding efficiency, CVR pinpoints conversion issues, and CPMr highlights audience fatigue. Together, these metrics empower you to make smarter, data-driven decisions that can directly impact your revenue.
Businesses that consistently track and refine their campaigns using these metrics tend to outperform those that only check sporadically. And when you're spending hundreds or even thousands of dollars daily, that difference adds up fast.
Looking ahead to 2026, creative fatigue is shaping up to be the biggest hurdle to scaling. As budgets grow, audiences are exposed to the same ads more often, and performance drops off sharply. The key to overcoming this challenge? Maintaining a high creative velocity - rolling out fresh ad variations faster than your audience can tire of them. This is where ADEN'S LAB can make all the difference. Instead of waiting days and paying $30–$50 per ad, you can produce dozens of high-performing static Meta ads in just minutes, with some plans costing as little as $0.90 per ad. This approach helps keep your CPAs low and your ROAS high, even as you scale aggressively.
FAQs
What ROAS do I need to be profitable?
A profitable ROAS (Return on Ad Spend) largely depends on your profit margins. That said, a ROAS of 3.8:1 or higher is often considered a solid benchmark for Meta ad campaigns. However, it's crucial to factor in your unique costs and margins to pinpoint the ROAS your business needs to achieve profitability.
When should I scale vs pause a Meta campaign?
When running a Meta campaign, it’s smart to pause it if your CPA (Cost Per Acquisition) goes beyond your break-even point by 20% after hitting 2,000 impressions. On the flip side, only scale the campaign when your ROAS (Return on Ad Spend) is consistently 30% higher than your target for three consecutive days.
To make decisions based on reliable data, wait for stability - this means giving the campaign 48-72 hours after launching or making edits. During this time, aim for at least 1,000 impressions and 30–50 conversions. When scaling, take it slow. Gradual increases, like 10–25% in budget, help avoid performance dips caused by sudden changes.
Which KPI best reveals creative fatigue first?
One of the clearest indicators of creative fatigue is CTR (Click-Through Rate). Why? Because CTR is directly tied to the effectiveness of your creative elements - whether it's static images or videos. If you notice a sharp decline in CTR, it’s often a sign that your ads are losing their appeal. Keeping an eye on this metric allows you to spot when your audience is no longer engaging with your content, giving you the chance to update your creatives before your ad performance takes a hit.
Your next ad batch starts here
Finish with a ready-to-test ad batch
Paste your website to generate static creatives. Drop the link → get ads in about 90 seconds → upload them to Meta → scale.
Free to try No prompt writing