Video vs Image Meta Ads: When Each Format Wins by Funnel Stage video vs image Meta
Build the ads while the examples are fresh
Turn your product page into static ad creatives
Paste your product URL and generate scroll-stopping images, headlines, and primary text—ready for your next Meta creative test.
Free to try No prompt writing

Video vs. Image Ads on Meta: Which Works Best and When?
Key Takeaway:
Video ads are better for grabbing attention and building trust, especially at the awareness stage. Image ads, however, dominate when it comes to driving conversions and reducing acquisition costs, particularly at the bottom of the funnel.
Quick Overview:
- Video Ads: Higher engagement (27% better CTR), longer creative lifespan, better for storytelling, and ideal for top-of-funnel (TOFU) campaigns.
- Image Ads: Lower cost per acquisition (~$34.50 CPA), faster to produce/test, especially when automating Meta ad production, better for conversions, and excel at bottom-of-funnel (BOFU) campaigns.
Quick Comparison Table:
| Metric | Video Ads | Image Ads |
|---|---|---|
| Primary Goal | Awareness, engagement | Conversions |
| Avg. CTR | 1.9%–2.31% | 1.1%–1.74% |
| Avg. CPA | ~$48.20 | ~$34.50 |
| Best Funnel Stage | TOFU | BOFU |
| Creative Fatigue | 40–60 days | 20–30 days |
| Production Cost | $200–$15,000 | $50–$200 |
Summary:
- Use videos to attract and engage new audiences (TOFU).
- Use images for retargeting and closing sales (BOFU).
- Test image ads first to identify winning angles before investing in videos.
The right choice depends on your funnel stage, budget, and campaign goals.
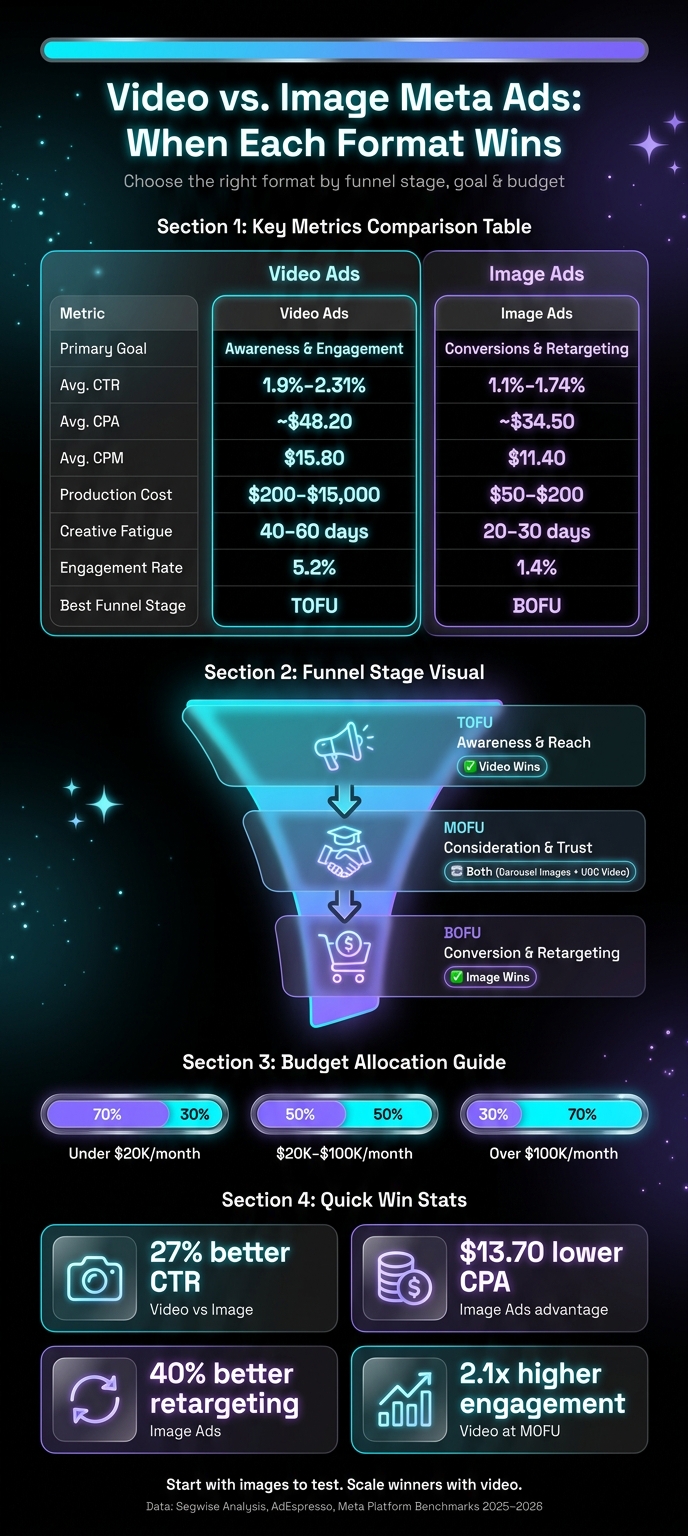
Video vs Image Meta Ads: Performance & Funnel Stage Comparison
Key Differences Between Video and Image Ads
Performance Characteristics
When comparing video and image ads, the choice often boils down to engagement versus efficiency. Video ads are designed to captivate and tell a story, boasting a 5.2% engagement rate compared to just 1.4% for static images. They also deliver 80% better brand recall, making them a powerful tool for reaching and engaging new audiences.
On the other hand, static image ads shine when it comes to conversions. They consistently deliver a lower cost per acquisition (CPA) - $34.50 versus $48.20 for video ads - and are responsible for most direct-response results on Meta platforms. Plus, their flexibility makes them ideal for placements like Facebook's Right Column, which only supports images, and the Audience Network, where static formats integrate more seamlessly.
"Video wins on reach and engagement. Static wins on cost-per-acquisition." - Segwise Analysis
Another key difference is creative fatigue. Static ads tend to lose their effectiveness 30–50% faster than video ads, often requiring updates every 20–30 days. In contrast, video creatives can maintain their performance for 40–60 days, offering more longevity - a critical factor for teams with limited creative resources.
Production and Testing Considerations
The way these formats are produced and tested also plays a big role in choosing between them. While the cost of producing a polished video through an agency can range from $3,000 to $15,000, static image ads are far more affordable, typically costing $50 to $200 per asset. Interestingly, user-generated videos - shot on smartphones with minimal editing - can cost between $200 and $900 and often outperform high-budget studio productions.
Static ads are also much faster to test. You can create and evaluate up to 10 variations of static ads in the time it takes to produce a single video edit. This makes static ads an excellent tool for testing hooks, messaging, and creative angles before investing heavily in video production. Many performance marketers use this strategy to validate their ideas before scaling up with video campaigns.
"The brands that win the paid social game in 2026 are not the ones with the best production value... They're the ones with the fastest creative learning loops." - Sachit Sharma, CEO of Deepsolv
Comparison Table: Video vs Image Ads
Here’s a side-by-side breakdown of how video and image ads perform across key metrics:
| Attribute | Video Ads | Image Ads |
|---|---|---|
| Primary Goal | Awareness, storytelling, engagement | Direct response, conversions, retargeting |
| Avg. CTR | 1.9%–2.31% | 1.1%–1.74% |
| Avg. CPA | ~$48.20 | ~$34.50 |
| Avg. CPM | $15.80 | $11.40 |
| Production Cost | $200–$15,000 | $50–$200 |
| Testing Speed | Slow (hours to days) | Fast (10–60 minutes) |
| Creative Fatigue | 40–60 days | 20–30 days |
| Best Funnel Stage | Top of funnel (prospecting) | Bottom of funnel (retargeting) |
| Best Placements | Reels, Stories, Feed | Feed, Right Column, Audience Network |
These distinctions make it easier to choose the right format depending on your campaign goals and where your audience is in the funnel.
Put the playbook to work
Apply this playbook to your page
Paste your website and the Lab will turn the strategy you are reading into a ready-to-test ads.
Free to try No prompt writing
Video Ads by Funnel Stage: When They Win
Top of Funnel (TOFU): Awareness
Video ads shine at grabbing attention and making a strong first impression. At the TOFU stage, video ads boast a 34% scroll-stop rate and a +12.5-point ad recall lift, with an average viewing time of 4.7 seconds - outperforming static images in every metric. They also come with a cost advantage, with an average CPM of $8.40, compared to $11.20 for static images. Additionally, Reels placements now make up 38% of all Meta video impressions, making vertical and square formats crucial for success.
For TOFU videos, keep them under 15 seconds, grab attention with a strong visual in the first 3 seconds, and always design for sound-off viewing by including captions. A hook rate above 25–30% is what you should aim for.
"Video is no longer a premium-budget play. UGC-style video - shot on a phone, edited with a free tool - can outperform polished production." - Angad Singh, Segwise
Middle of Funnel (MOFU): Consideration
Once you've captured attention at the TOFU stage, videos take on a different role at MOFU. Here, the focus shifts to building trust with content like product demos, founder stories, and customer testimonials. Video ads at this stage deliver 2.1x higher engagement rates than static images, with an average engagement rate of 5.2%, compared to 1.4% for image ads.
MOFU videos work best when they’re 30–60 seconds long, providing enough time to explain a product or showcase a customer success story. Keep an eye on hook and hold rates to ensure your message is landing effectively.
Take this example: In April 2026, a Series A SaaS startup offering project management software allocated an $18,000 budget over six weeks, splitting it between video and image ads. This process is often optimized by scaling Meta ads with AI budget allocation to ensure maximum efficiency. The video campaign featured 15-second demos, 30-second problem-solution clips, and 60-second testimonials. While image ads had a slightly lower Cost Per Lead ($40.00 vs. $45.45), leads from video ads were better qualified, narrowing the pipeline-per-dollar gap to just 6%.
Bottom of Funnel (BOFU): Conversion
At the BOFU stage, video ads take on the role of validation, offering the proof necessary to convert hesitant buyers. Whether it’s testimonials, detailed product walkthroughs, or real-world use-case demonstrations, video is often the deciding factor for complex products, high-ticket services, or anything that benefits from a visual explanation.
The key at BOFU is to provide proof. Video ads resist creative fatigue longer - lasting 40–60 days, compared to 20–30 days for static ads - making them ideal for retargeting smaller, high-intent audiences who see your ads repeatedly.
"The format debate misses the real lever: matching creative to funnel stage and spend tier." - Jason Loyed, Media Buyer, EcomParkour
For BOFU, stick to 30–60 second videos with a clear proof point and a strong call to action. If your hook and hold rates start to drop, it’s a sign that creative fatigue is setting in, and it’s time to refresh your content and scale winning creatives before your ROAS takes a hit.
Next, we’ll dive into when image ads outperform video across different funnel stages.
Image Ads by Funnel Stage: When They Win
Top of Funnel (TOFU): Awareness
Image ads might not grab attention like videos, but they excel in efficiency. With CPMs that are 40–60% lower than video ads, static images allow you to reach a large audience without overspending. They deliver your core message instantly - an essential feature when users are quickly scrolling past ads.
Another big advantage? Speed. You can create and test over 10 image variations in the time it takes to produce a single video. And the cost? Just $50 to $200 per image asset.
"A well-designed image with strong copy can convey your offer in under one second. Video requires attention investment that cold audiences may not give." - Matt Pru, Stackmatix
Middle of Funnel (MOFU): Consideration
Image ads aren’t just efficient at the awareness stage - they also shine when it’s time to deepen engagement. The rapid testing you’ve done at TOFU carries over, as validated messaging can be repurposed for carousel ads, setting the stage for better performance at the bottom of the funnel.
Carousels are the MVP of image formats at MOFU. They let you showcase multiple product features, tackle objections, or highlight customer reviews - all in one ad unit. This format can lower cost-per-conversion by 20–50% compared to single image ads.
For SaaS and B2B brands, static images of product dashboards or detailed UI screenshots are especially effective. They explain complex features in ways short videos often can’t. The secret to success? Keep each carousel card focused on one idea, so users can explore at their own pace.
Bottom of Funnel (BOFU): Conversion
At the conversion stage, image ads bring it all together. They already account for 60–70% of all conversions on Meta platforms. Many of these conversions are driven by Meta Advantage+ placements that optimize delivery across the ecosystem. In retargeting campaigns, they outperform video by 40%. By this point, your audience knows your brand - they don’t need a long story, just a clear offer and a strong call-to-action.
A simple image ad with a CTA like "Shop Now" or "Claim Your Discount" gets straight to the point. There’s no waiting for a hook or relying on sound - the message is immediate.
"For retargeting - where the viewer already knows your brand - that directness [of static ads] converts." - AdDogs
The numbers back this up. In a $1,000 AdEspresso experiment aimed at driving eBook signups, a single image ad produced a CPL of $2.30, outperforming video ($3.10 CPL) and carousel ads ($7.00 CPL). For BOFU campaigns, adding price overlays or discount callouts directly onto the image can significantly improve ROAS. Price overlays alone can boost ROAS by 41%, while highlighting discounts can increase it by 57%.
To maintain strong conversion rates in retargeting, where your audience is smaller and sees your ads more often, it’s essential to rotate creatives every 20–30 days.
How to Choose the Right Format by Funnel Stage and Business Type
Funnel Stage Decision Framework
The format you choose should align with where your audience is in the funnel. For cold audiences who don’t know your brand yet, short-form videos can grab attention and spark interest. For warm audiences already familiar with you, static images deliver a clear, fast message that drives action.
Here’s a quick guide to match formats with funnel stages:
| Funnel Stage | Primary Goal | Recommended Format | Supporting Format |
|---|---|---|---|
| TOFU (Awareness) | Reach & Recall | Short-form Video / Reels | Single Image (for testing) |
| MOFU (Consideration) | Education & Trust | Carousel Ads | Explainer Videos / UGC |
| BOFU (Conversion) | Direct Action | Single Image (Offer-led) | Dynamic Product Ads (DPA) |
A practical approach is to start with static images to test messaging. Once you identify what works, reinvest in videos to amplify those successful angles. Budget also matters. If you’re spending under $20K/month, allocate about 70% to static ads for quick testing. For budgets between $20K–$100K/month, aim for a 50/50 or 60% video mix. For budgets exceeding $100K/month, focus 65–70% on video since Meta tends to favor immersive formats like video.
This framework provides a starting point. Your business type will further refine how you apply it.
Business Model Considerations
Your business model plays a key role in deciding how to balance video and static ads.
E-commerce brands should lean towards video when the product benefits from visual storytelling. For example, Shapellx, a shapewear brand, used a 97% video ad mix to highlight body transformation results - something static images couldn’t convey effectively. On the flip side, SHEIN relied on just 1% video, focusing instead on high-volume static product shots. Their brand recognition and competitive pricing drove conversions without needing video. If your product’s appeal lies in visible results, video is essential. But if the product is self-explanatory, static images can scale faster.
SaaS companies often find success with a 70% static and 30% video split. Use short 15-second demo videos at the awareness stage to introduce your product, then switch to static ads for offers like free trials. A test conducted in April 2026 showed static ads generated more leads at a lower cost-per-lead (CPL), while video leads were more qualified, narrowing the gap in pipeline efficiency.
Lead generation businesses should see video and static formats as complementary tools. Static images are great for quickly testing hooks and driving form fills. Meanwhile, videos help pre-qualify leads by providing more in-depth storytelling, which naturally attracts higher-quality prospects.
"The real question isn't 'which format is better.' It's 'which mix fits what my brand actually needs to do right now?'" - Angad Singh, Marketing and Growth, Segwise
Image Ads vs Video Ads on Meta - Explained
Conclusion: Picking the Right Ad Format to Improve ROI
There's no one-size-fits-all solution when it comes to ad formats. Videos work best for top-funnel awareness, grabbing attention and building brand recognition. Static images shine in the mid-funnel, driving engagement and nurturing interest. And at the bottom of the funnel, it's worth experimenting with both formats to find what converts best.
Static ads, in particular, are a great tool for quick testing. They’re fast to create, budget-friendly, and provide valuable data that can guide investments in more resource-intensive video production.
"The strongest approach is format-matching to funnel position: video at the top, images in the middle, and test both at the bottom."
By tailoring your ad format to the right stage of the funnel, you can boost engagement, improve conversions, and keep costs in check.
However, keep in mind that static ads tend to burn out faster than videos - losing effectiveness in just 20–30 days, which is 30–50% quicker than video formats. To tackle this challenge, having a system in place to refresh creatives regularly is key.
That’s where ADEN's LAB comes in. Their AI-powered static ad engine, designed specifically for Meta platforms, can produce eye-catching Facebook and Instagram ads in under 90 seconds. With the Apex Mode plan, ads cost just $0.90 each, and you can create up to 200 ads per month. This makes it easier to combat creative fatigue while enabling ongoing testing and scaling.
FAQs
How do I split my budget between video and image ads?
When planning your budget, align it with the stages of your sales funnel. Begin with a 50/50 split between image and video content at the top of the funnel. During sales pushes, prioritize image-focused content to grab attention quickly. For retargeting efforts, shift to a 30/70 ratio, favoring video over images to engage users more deeply.
Here’s a simple spending guideline based on your monthly ad budget:
- Under $5,000/month: Allocate about 60% to images.
- Over $20,000/month: Dedicate 75% to video.
- Around $8,500/month: This is the crossover point where you can start leaning more heavily into video.
Adjust these ratios as needed to fit your specific goals and audience preferences.
What metrics should I use to compare video vs. image ads?
When evaluating video and image ads, it's crucial to align metrics with different stages of the marketing funnel. Here's how these two formats stack up when analyzed across key performance indicators:
Awareness and Engagement Metrics
For the awareness and engagement stage, metrics like CTR (Click-Through Rate), engagement rate, and video completion rates (e.g., 3-second views or ThruPlays) are vital. Video ads often excel here because they provide a dynamic way to grab attention and tell a story. Metrics like hook rates (how well the first few seconds grab viewers) and hold rates (how long viewers stay engaged) are particularly important for assessing video performance.
Image ads, on the other hand, rely on static visuals and concise messaging. While they may not hold attention as long as videos, they can still drive a strong CTR if the creative is compelling and the message is clear.
Traffic Efficiency Metrics
When it comes to traffic efficiency, measured by CPC (Cost Per Click), the format's performance can vary based on the audience and objective. Image ads often have lower CPCs due to their simplicity and quicker load times. However, video ads can sometimes justify higher CPCs if they effectively drive deeper engagement or pre-qualify traffic by delivering more information upfront.
Conversion Metrics
For conversions, using metrics like CPA (Cost Per Acquisition), CPL (Cost Per Lead), or ROAS (Return on Ad Spend) helps determine which format delivers better results. Image ads tend to work well for straightforward offers or products, especially when the audience is already familiar with the brand. Video ads, however, may perform better for complex products or services, as they provide more context and can address potential objections directly in the ad.
Additional Metrics to Monitor
- CPM (Cost Per Mille): Track how cost-efficiently each format reaches 1,000 impressions.
- Frequency: Keep an eye on how often the same ad is shown to the audience to avoid oversaturation.
- Creative Fatigue: For video ads, monitor hook and hold rates to identify when the content starts losing its impact. For image ads, look at engagement drops over time.
Ensuring a Fair Test
To make an apples-to-apples comparison, ensure both ad formats share the same variables:
- Objective: Use the same campaign goal (e.g., conversions, traffic, or engagement).
- Audience: Target identical demographics and interests.
- Placements: Test both formats across the same platforms and ad placements.
- Landing Page: Direct traffic to the same destination to eliminate discrepancies in user experience.
By aligning metrics with funnel stages and maintaining consistent testing conditions, you can accurately assess which ad format delivers the best results for your specific goals.
When should I refresh creatives to avoid ad fatigue?
To keep your Meta ads performing well and avoid ad fatigue, it's important to refresh underperforming creatives regularly - ideally every 2–3 weeks. For image ads, fatigue often sets in by day 7 once the frequency hits 3 or higher. On the other hand, short video ads (9–15 seconds) tend to stay effective until around day 11.
A good strategy is to test at least three variations per format for each campaign. Keep a close eye on click-through rates (CTR) and engagement metrics, and replace ads that show a decline to sustain strong results.
Your next ad batch starts here
Finish with a ready-to-test ad batch
Paste your website to generate static creatives. Drop the link → get ads in about 90 seconds → upload them to Meta → scale.
Free to try No prompt writing