10 Meta Ad Metrics Pros Track (But You Don’t Yet)
Turn the strategy into creatives
Create Meta ads for your product
Paste your product page. ADEN'S LAB turns the offer, audience, and positioning into complete ready-to-use Meta static ads.
Free to try No prompt writing
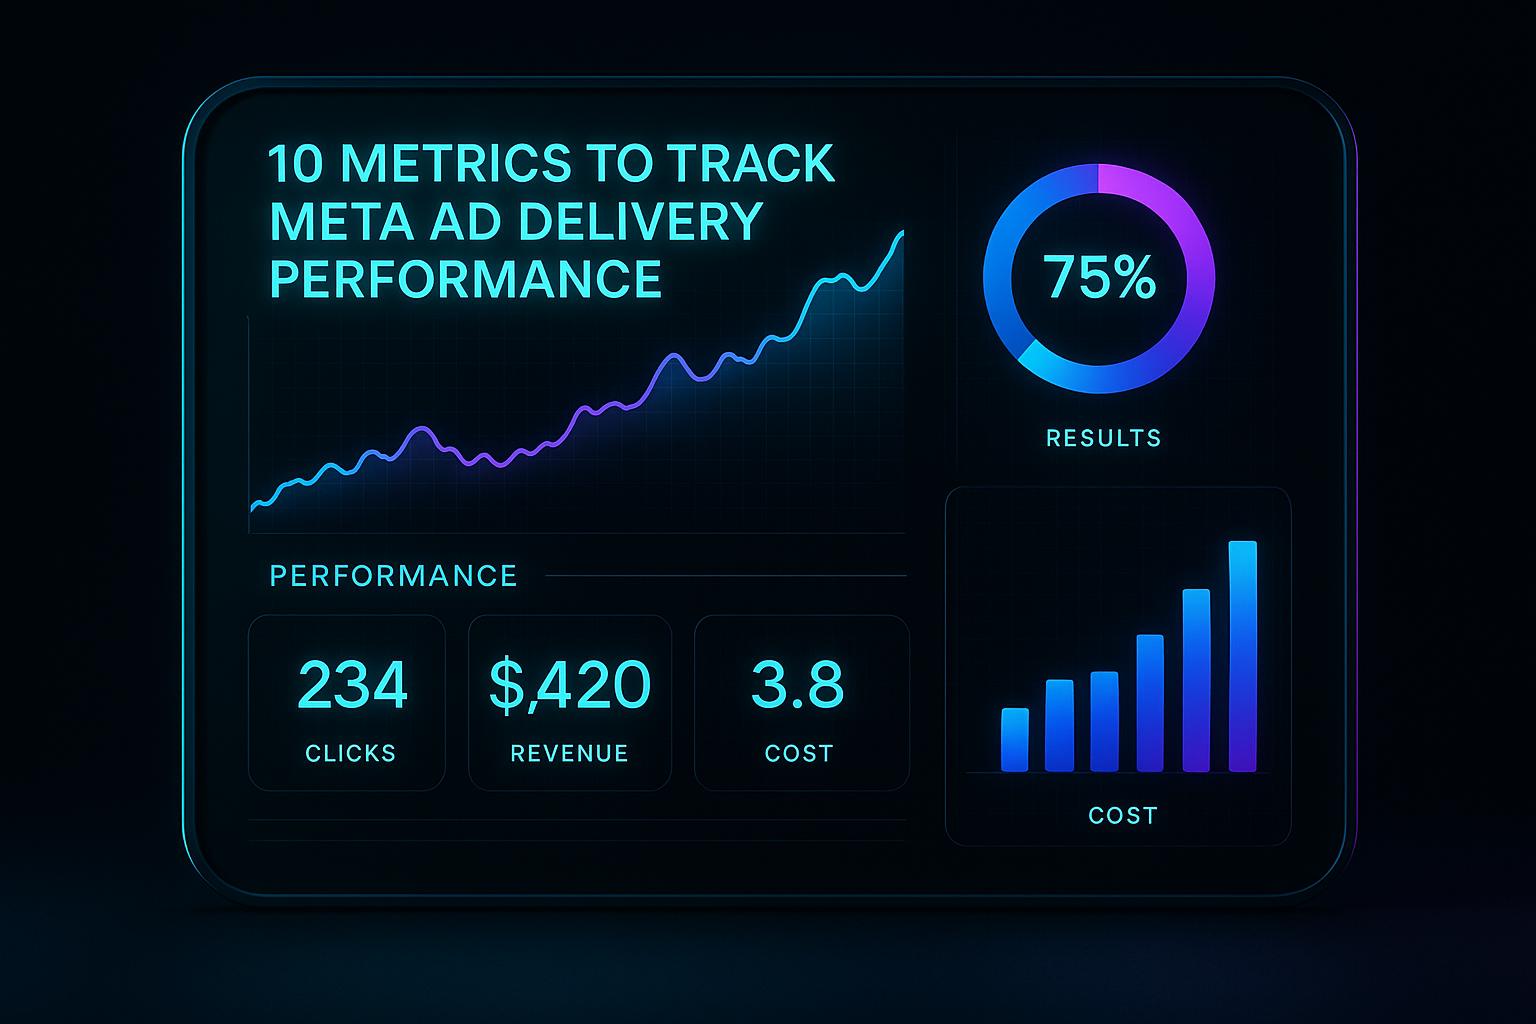
Running Meta ads without tracking key metrics? That’s like driving blindfolded. With over 350 metrics available in Facebook Ads Manager, knowing which ones to focus on can make or break your campaign. Here are the 10 key metrics every marketer needs to monitor for better ad performance, lower costs, and higher ROI:
- Click-Through Rate (CTR): Measures how engaging your ad is. Aim for 2%-5%.
- Cost Per Click (CPC): Tracks how much you pay for each click. Keep it between $0.50-$2.00.
- Conversion Rate: Shows how well clicks turn into actions. A strong rate is 5%+.
- Cost Per Thousand Impressions (CPM): Indicates the cost of showing your ad 1,000 times. Target $5-$10.
- Ad Impressions: Total times your ad is displayed. High impressions with low CTR? Time to tweak.
- Reach: Unique users who see your ad. Focus on growing this alongside engagement.
- Engagement Rate: Tracks likes, shares, and comments. 3%+ is ideal.
- Return on Ad Spend (ROAS): Measures revenue generated per ad dollar. Profitable campaigns hit 3:1 or higher.
- Ad Relevance Score: Ranks how well your ad connects with its audience. Higher scores reduce costs.
- Frequency: Tracks how often users see your ad. Keep it below 3 to avoid fatigue.
Pro Tip: Use tools like ADEN'S LAB to automate creative testing, optimize performance, and save time.
Mastering these metrics ensures you're spending ad dollars wisely, engaging your audience, and driving results. Let’s dive deeper into each metric.
Top 16 Facebook Ads Metrics 🔊
Put the playbook to work
Apply this playbook to your page
Paste your website and the Lab will turn the strategy you are reading into a ready-to-test ads.
Free to try No prompt writing
1. Click-Through Rate (CTR)
Click-Through Rate (CTR) measures the percentage of people who click on your ad after seeing it. To calculate it, divide the number of clicks by the number of impressions, then multiply by 100. For example, if your ad gets 50 clicks from 5,000 impressions, your CTR is 1%.
CTR is a strong indicator of how well your ad connects with your audience. A click signals that your creative, message, or offer resonates with viewers.
Impact on Ad Performance and ROI
CTR plays a big role in determining your campaign's success. A higher CTR means more people are engaging with your ad, which increases the chances of achieving your goals - whether that's making a sale, getting sign-ups, or driving traffic to your site.
For Meta ads, CTRs between 2% and 5% are considered successful. On the other hand, a CTR below 0.9% suggests underperformance and signals that your ad needs immediate adjustments.
A higher CTR also benefits your ad's delivery. Meta's algorithm interprets a strong CTR as a sign of valuable content, leading to better placements, lower costs, and more exposure. Essentially, the better your CTR, the more efficiently your ads perform.
Relevance to Meta Ad Delivery Optimization
Meta's ad delivery system rewards ads with higher CTRs because they show relevance and engagement. When your ads consistently achieve strong CTRs, the algorithm prioritizes them, offering improved placements, lower cost-per-click, and broader reach.
This creates a positive cycle: higher engagement boosts delivery efficiency, which can lead to more impressions at a lower cost. On the flip side, ads with low CTRs often face reduced visibility and higher costs.
Actionable Tips for Marketers
To boost CTR, marketers should focus on refining their ad copy, using eye-catching visuals, and targeting the right audience segments.
For example, an e-commerce brand struggling with a low CTR of 0.7% revamped their ad image and headline. This simple update increased their CTR to 1.5% - a significant improvement.
Boosting CTR with AI Tools like ADEN'S LAB
AI-powered platforms, such as ADEN'S LAB, can take CTR optimization to the next level. These tools can quickly generate and test multiple ad creatives, helping marketers identify the ones that perform best.
Instead of spending weeks manually creating and testing ads, AI tools can produce dozens of variations in seconds, each designed to maximize engagement. This allows marketers to test faster, scale successful ads more efficiently, and ultimately achieve better results with less effort. By leveraging these tools, brands can supercharge their campaigns and see stronger CTRs, leading to better overall performance and ROI.
2. Cost Per Click (CPC)
Cost Per Click (CPC) tells you how much you’re paying every time someone clicks on your Meta ad. To calculate it, simply divide your total ad spend by the number of clicks. For instance, if you spend $100 and get 50 clicks, your CPC is $2.00.
This metric gives you a clear picture of how cost-efficient your ads are. It’s just as important as tracking your CTR when evaluating overall ad performance.
Impact on Ad Performance and ROI
CPC doesn’t just reflect costs - it directly influences your campaign’s ROI. For Meta ads, the average CPC typically falls between $0.50 and $2.00. However, industries like finance or insurance often see higher rates. Knowing these benchmarks can help you determine whether your campaigns are running efficiently.
For example, if your CPC is $1.50 and each click generates $4.50 in revenue, that’s a solid 3:1 ROI. On the other hand, if you’re paying $1.00 per click but not seeing returns, it’s a sign of underperformance.
How CPC Ties Into Meta's Optimization
Meta’s algorithm uses CPC as part of its ad delivery optimization. Lower CPCs signal better engagement, prompting Meta to prioritize your ad placements. This creates a cycle where engaging ads stretch your budget further, while less effective ads drive up costs. When your ads resonate with your audience, higher engagement naturally lowers CPC, improving overall results.
Tips for Reducing CPC
Keeping CPC in check requires consistent optimization. Here are a few strategies to help:
- Refresh ad creatives regularly: Updating your ads every 7–14 days can prevent audience fatigue, which often leads to rising CPCs.
- Fine-tune targeting: Refine your audience settings to ensure your ads reach the right people.
- Test ad variations: Experiment with different formats and messaging to see what resonates best.
- Leverage Meta’s automated bidding: Let Meta adjust bids in real time to align with your campaign goals.
Next, we’ll dive into how creative automation can make managing CPC even easier.
Using AI Tools Like ADEN'S LAB to Improve CPC
AI-powered platforms, such as ADEN'S LAB, can take your CPC management to the next level. These tools generate hundreds of optimized ad variations in seconds, eliminating the need for manual testing. By consistently producing fresh, tailored creatives, AI tools help keep CPC low while maximizing reach and conversions. This means you can save time and resources while ensuring your ads stay relevant and engaging. With AI on your side, optimizing for CPC becomes significantly more manageable.
3. Conversion Rate
The Conversion Rate tells you the percentage of people who click on your Meta ad and go on to complete a specific action, like making a purchase or signing up for a newsletter. To calculate it, divide the number of conversions by the total clicks, then multiply by 100. For example, if your ad gets 100 clicks and 5 of those clicks result in conversions, your conversion rate is 5%.
Impact on Ad Performance and ROI
Conversion rate plays a big role in determining how effective your ad spend is. A higher rate means you're getting more value for your money, while a lower one might suggest it's time to tweak your strategy. For instance, if your cost per click (CPC) is $1.50 and your conversion rate is 10%, you're spending $15 per conversion. But if your conversion rate drops, your cost per conversion increases, making your campaigns less efficient. These insights can guide you in fine-tuning your Meta ad campaigns for better results.
Relevance to Meta Ad Delivery Optimization
Meta prioritizes ads that generate conversions by giving them better placements and reducing their costs. The platform's optimization tools rely on historical conversion data to target users who are more likely to take the desired action. To make the most of these features, you need a strong pool of conversion data to work from.
Actionability for Marketers
Boosting your conversion rate often starts with improving your ad creative and landing page. Your landing page should align closely with the promises made in your ad. Additionally, refining your audience targeting - such as narrowing in on users who have already interacted with your brand - can lead to better results. Regular testing of creative elements like messaging, visuals, and calls-to-action can also help you discover what resonates most with your audience.
Enhancing Conversion Rates with AI-Powered Tools
AI-powered platforms like ADEN'S LAB can simplify the process of improving your conversion rate. By generating multiple ad variations, these tools help you pinpoint the combinations of creative elements that work best, ultimately boosting your campaign performance and driving better results.
4. Cost Per Thousand Impressions (CPM)
Cost Per Thousand Impressions (CPM) is a metric that tells you how much you're paying for every 1,000 times your Meta ad is displayed, whether or not users engage with it. To figure out your CPM, divide your total ad spend by the number of impressions (in thousands). For instance, if you spend $500 and your ad gets 100,000 impressions, your CPM would be $5.
This metric is a valuable indicator of how far your budget goes in terms of visibility. Unlike metrics that focus on conversions, CPM zeroes in on the cost of exposure. It provides insight into your ad's reach and how efficiently your budget translates into audience impressions.
Impact on Ad Performance and ROI
CPM plays a direct role in how your budget is allocated and how wide your campaign's reach can be. A lower CPM means more visibility for your spend, potentially leading to higher conversions. However, a low CPM doesn't automatically translate into a strong ROI. Factors like ad relevance, precise targeting, and creative quality still heavily influence performance.
When CPMs rise sharply, it often points to increased competition for your audience or a drop in your ad's relevance. For example, Meta ad CPMs in the U.S. typically range from $8 to $14, but they can vary significantly depending on industry trends and seasonal demand. During high-demand times like Black Friday or the holiday season, CPMs can jump by 30–50%. Being aware of such fluctuations can help you fine-tune your campaigns for better results.
Relevance to Meta Ad Delivery Optimization
CPM is a fundamental metric that reflects how well Meta's algorithm is distributing your ads. Meta uses CPM data along with engagement metrics to decide ad placement and frequency. A sudden spike in CPM without improvements in other metrics could signal that your ads are losing relevance or facing stiffer competition in the auction.
Meta prioritizes ads that strike a balance between engagement and cost. By keeping an eye on your CPM trends, you can spot issues like oversaturated targeting or creative fatigue, both of which can drive up costs and hurt delivery efficiency.
Actionable Steps for Marketers
To improve your CPM performance, consider these strategies:
- Refine audience targeting: Avoid highly competitive or oversaturated segments to see immediate cost improvements.
- Test different ad creatives: Keep your audience engaged by experimenting with new messaging or visuals.
- Adjust bidding strategies: Try switching between manual and automatic bidding or tweaking bid caps to find the optimal balance between cost and delivery.
- Monitor ad frequency: High frequency can lead to ad fatigue, reducing engagement and driving up costs.
Regularly compare your CPM trends with industry benchmarks to ensure your campaigns remain cost-efficient. Fine-tuning CPM works hand-in-hand with other metrics to optimize your Meta ad performance.
Using AI Tools to Improve CPM
AI tools like ADEN'S LAB can help lower CPM by generating multiple creative variations quickly. These variations boost engagement and relevance, which in turn reduces CPM. With a lower CPM, your ads can reach more people for the same budget, maximizing exposure and efficiency.
5. Ad Impressions
Ad impressions refer to the total number of times your Meta ad appears on users' screens, whether or not they interact with it. Every time your ad shows up in someone's feed, it's counted as an impression. This is different from reach, which tracks the number of unique users who see your ad. For instance, if one person views your ad three times and another person sees it twice, you’ve tallied 5 impressions but only 2 reach. Understanding this distinction is crucial for grasping metrics like ad reach and frequency.
Impressions also serve as the foundation for calculating key performance indicators like click-through rate (CTR), conversion rate, and return on ad spend (ROAS).
Impact on Ad Performance and ROI
Ad impressions play a big role in determining how effective your campaign is and how much return you’re getting on your investment. While a high impression count suggests that your ad is reaching a broad audience, quality matters more than quantity. For example, if your impressions are high but your CTR falls below 0.9%, it’s a sign that your creative or targeting might need fine-tuning. Impressions are also essential for calculating Cost Per Thousand Impressions (CPM). If your CPM is climbing but engagement isn’t improving, it could indicate rising competition or that your ad’s relevance is decreasing.
Relevance to Meta Ad Delivery Optimization
Meta’s algorithm uses impression data, along with engagement metrics, to fine-tune ad placement and delivery. A related metric to keep an eye on is frequency, which measures how often, on average, a user sees your ad. For cold audiences, a frequency above 2.5, and for retargeting campaigns, a frequency over 4.0, can lead to audience fatigue and drive up costs. Warning signs include a rapid increase in impressions without a corresponding rise in reach or a drop in impressions despite a steady budget. These could indicate that Meta’s algorithm is limiting delivery due to low ad relevance.
Actionable Insights for Marketers
Impression data can guide marketers in improving campaign performance. Start by monitoring how quickly impressions are being delivered (impression velocity) and adjust your budget accordingly. Look at the ratio of impressions to outcomes to identify ads that are being seen but not driving action. Break down your data by placement, time of day, and audience demographics to allocate your budget more effectively. Tracking impressions alongside frequency can also help you spot when your audience is being oversaturated. If this happens, it might be time to refresh your creative assets - ideally every 7–14 days - or tweak your targeting strategies.
Enhancing Results with AI Tools Like ADEN'S LAB
AI-powered platforms, such as ADEN'S LAB, can help boost the performance of your impressions by generating creative variations that are designed to drive engagement and conversions. With tools like ADEN'S LAB, you can test multiple creative options - up to 10 times faster than traditional methods. This ensures your ads stay fresh and engaging, preventing creative fatigue while maximizing the impact of every impression. By automating creative generation, platforms like this make it easier to maintain strong ad performance over time.
6. Reach
Reach measures the number of unique users who see your Meta ad. Unlike impressions - which count every instance your ad is displayed, even if the same person sees it multiple times - reach focuses solely on distinct individuals. For instance, if your ad generates 10,000 impressions but only 4,000 unique viewers, your reach is 4,000, not 10,000.
This metric is crucial for understanding how many people your campaign is truly connecting with. Meta's data shows that campaigns optimized for reach can deliver up to 2.2x better brand recall compared to those focused on impressions. By tracking reach, you can gauge whether you're successfully expanding your audience or simply overexposing the same group.
Impact on Ad Performance and ROI
Reach plays a big role in determining how well your campaign performs and how efficiently you're spending your ad budget. While higher reach can amplify brand awareness, low engagement might suggest poor targeting, which wastes resources. In 2024, Facebook ads in the U.S. had an average reach of about 34% of the platform's monthly active users, though this varied by industry and campaign goals. Additionally, a Wordstream study found that campaigns reaching over 100,000 unique users saw a 17% greater lift in brand awareness compared to those with smaller audiences.
Relevance to Meta Ad Delivery Optimization
Meta's ad delivery system uses algorithms to prioritize showing your ads to users who are more likely to engage. If your reach stalls while impressions keep climbing, it could mean your audience is saturated or your ads are being shown too frequently. Small tweaks to your targeting or ad creatives can make a big difference in visibility.
Actionability for Marketers
To make the most of your reach, fine-tune your targeting and keep an eye on engagement metrics. For example, if your reach is high but your click-through rate (CTR) is under 2%, consider narrowing your audience or using lookalike audiences. Similarly, if your ad frequency exceeds 2.5 for cold audiences or 4.0 for retargeting, it might be time to update your creatives or broaden your targeting.
Meta Ads Manager offers custom reporting tools that allow you to break down reach by demographics, placement, and time periods. These insights can help you pinpoint which audience segments deliver the best reach at the lowest cost.
Using AI-Powered Tools Like ADEN'S LAB to Enhance Reach
Platforms like ADEN'S LAB can take your reach optimization to the next level. These AI-driven tools automate creative testing and audience analysis, generating hundreds of ad variations to quickly identify what works best. This not only boosts your reach and engagement but also saves you time by reducing manual effort.
7. Engagement Rate
Engagement rate is a key metric that shows how users interact with your Meta ads. It’s calculated using the formula: (total engagements ÷ total impressions or reach) × 100. For example, if your ad gets 500 engagements from 10,000 impressions, your engagement rate would be 5%.
Unlike reach, which only tracks how many unique users see your ad, engagement rate digs deeper. It tells you how effective your content is at sparking actions - likes, comments, shares, clicks, and reactions. This makes it an essential measure of how engaging and action-driven your ad really is.
Impact on Ad Performance and ROI
A high engagement rate can be a game-changer for your campaign’s performance and return on investment (ROI). Meta’s algorithm views high interaction levels as a sign of quality, which can lead to better brand visibility, higher click-through rates, and stronger conversion rates. For example, a retail brand improved its engagement rate from 0.8% to 2.5% by shifting to video ads and fine-tuning its audience targeting. This resulted in a 30% boost in click-through rates and a 20% drop in cost per acquisition.
On the flip side, low engagement rates might highlight problems like weak ad creatives, poor targeting, or unclear messaging - issues that can drain your ad budget without delivering results.
Relevance to Meta Ad Delivery Optimization
Meta’s ad delivery algorithm prioritizes ads that generate more interactions. This means ads with higher engagement rates are more likely to be delivered to a broader audience at a lower cost. Essentially, engaging content creates a win-win: better delivery optimization and reduced costs per result. This positive cycle underscores why engagement rate is such a critical metric for ad performance.
Actionability for Marketers
If you want to boost your engagement rate, here are some practical strategies:
- Fine-tune audience targeting to connect with users who are more likely to interact with your ads.
- Pair compelling visuals with clear calls-to-action that encourage actions like commenting, sharing, or clicking.
- Experiment with different ad formats - carousel, video, or Stories - to see what resonates most with your audience. Video ads, for instance, often achieve engagement rates above 1%.
- Analyze engagement data regularly to identify successful creatives and replicate their best features across campaigns.
- Time your posts strategically to align with when your audience is most active.
Potential for Improvement Using AI-Powered Tools Like ADEN'S LAB
Platforms like ADEN'S LAB use AI to create ad creatives specifically designed for engagement. By enabling rapid testing of multiple creative variations, these tools help pinpoint top-performing ads and fine-tune campaigns to maximize engagement. This makes it easier for marketers to optimize their strategies and see better results faster.
8. Return on Ad Spend (ROAS)
Return on Ad Spend (ROAS) is a key metric that shows how much revenue is generated for every dollar spent on Meta ad campaigns. The calculation is straightforward: (total revenue ÷ total ad spend) × 100. For instance, if you spend $1,000 and generate $3,000 in revenue, your ROAS is 3:1.
This metric is a direct indicator of profitability. A ROAS of 100% means you're breaking even. Anything below that signals a loss and calls for immediate adjustments.
Impact on Ad Performance and ROI
ROAS is a clear reflection of how well your campaigns are performing financially. Industry standards suggest that a ROAS of at least 200% (a 2:1 ratio) is the minimum acceptable benchmark - this means $2 in revenue for every $1 spent. A solid performance typically falls between 300-400% (3:1 to 4:1), while results above 500% (5:1 or higher) are considered exceptional.
If your ROAS dips below 100%, it means you're operating at a loss, and it's time to re-evaluate your strategies. Beyond just measuring financial success, ROAS also sheds light on other critical factors like ad targeting, the quality of your creative assets, and how well your offer aligns with your audience's needs. Unlike metrics like engagement or reach, ROAS directly connects your ad spend to business outcomes.
| ROAS Performance Level | Ratio | Revenue per $1 Spent |
|---|---|---|
| Minimum Goal | 2:1 | $2.00 |
| Strong Performance | 3-4:1 | $3.00-$4.00 |
| Outstanding | 5:1+ | $5.00+ |
Relevance to Meta Ad Delivery Optimization
While Meta's ad delivery system doesn’t specifically optimize for ROAS, this metric is essential for making informed campaign decisions. Many brands and agencies rely on ROAS to decide whether to scale, pause, or tweak their campaigns. Tools like Meta Ads Manager provide real-time ROAS data, enabling marketers to quickly address underperforming campaigns.
ROAS trends can reveal critical insights about your campaign's health. A declining ROAS often signals that your ad creative has gone stale, your audience is oversaturated, or your targeting needs fine-tuning. These insights are invaluable for identifying areas to improve and ensuring your campaigns remain profitable.
Actionability for Marketers
To sustain or improve ROAS, it’s important to monitor it alongside other metrics like cost per acquisition (CPA), click-through rate (CTR), and conversion rate. This gives you a well-rounded view of your campaign’s performance. Refreshing ad creatives every 7-14 days can help combat audience fatigue and maintain strong ROAS.
When ROAS starts to drop, take a closer look at your creative assets, landing pages, and targeting strategies. Adjust your audience segments or offers based on the trends you see. Instead of trying to salvage consistently underperforming ad sets, reallocate that budget to campaigns or segments that are delivering better results.
Regular analysis of ROAS can also uncover your most profitable customer segments, ideal spending levels, and seasonal trends. These insights can guide future campaign planning. Additionally, leveraging AI tools can streamline the process of optimizing campaigns to achieve better ROAS.
Potential for Improvement Using AI-Powered Tools Like ADEN'S LAB
AI-powered platforms are game-changers when it comes to improving ROAS. Tools like ADEN'S LAB make it easier to create high-performing ad creatives quickly. By automating the testing of multiple ad variations, these platforms help boost engagement and conversion rates, ultimately driving higher ROAS.
9. Ad Relevance Score
The Ad Relevance Score is a tool Meta uses to measure how well your ads connect with their intended audience. It evaluates three main factors: ad quality, engagement rate, and expected conversion rate. This score isn’t static - it evolves as user interactions change. Meta’s algorithms constantly refine the score based on updates to your ad creative, targeting, or shifts in user behavior.
Impact on Ad Performance and ROI
A strong Ad Relevance Score can significantly improve your campaign’s performance and cost efficiency. Ads with higher relevance scores can see up to a 50% reduction in cost per result compared to those with lower scores. Studies show that better relevance can boost click-through rates by 20-30% while cutting ad costs by 10-50%. On the flip side, ads with poor relevance scores face reduced visibility and higher costs, which can hurt your return on investment (ROI).
| Relevance Level | Ad Delivery Priority | Cost Impact | Engagement Impact |
|---|---|---|---|
| High Score | Prioritized in auction | Lower CPC/CPM | Higher CTR, positive feedback |
| Low Score | Lower priority, less reach | Higher costs | Lower CTR, negative feedback |
This makes it clear why the Ad Relevance Score plays a critical role in optimizing ad delivery.
How It Fits Into Meta Ad Delivery Optimization
Meta’s ad delivery algorithm heavily relies on relevance to decide which ads to show, when, and to whom. The algorithm continuously assesses your ad’s performance based on the three diagnostic rankings, adjusting delivery accordingly. For instance, if your ad has low engagement, it may indicate that your targeting strategy needs fine-tuning. Similarly, a low ad quality ranking could mean your creative assets aren’t resonating with your audience. Meta Ads Manager offers detailed diagnostics to help you identify and address these issues.
Steps Marketers Can Take
Improving your Ad Relevance Score involves refining audience targeting, creative assets, and messaging. Testing multiple ad creatives and targeting strategies regularly can make a big difference. Use the relevance diagnostics in Meta Ads Manager to pinpoint problem areas. For example, if engagement is low, revisit your targeting strategy. If ad quality is the issue, focus on improving visuals and messaging. Common mistakes to avoid include failing to refresh ad creatives, misaligned messaging, and neglecting to monitor and adjust targeting strategies.
Using AI Tools Like ADEN'S LAB for Better Results
AI-powered platforms are changing how marketers approach ad relevance. Tools like ADEN'S LAB can create data-driven ad creatives tailored to your audience, boosting your Ad Relevance Score. These tools enable rapid testing of multiple ad variations, adapting to audience preferences in real time. Instead of manually crafting and testing dozens of ads, AI tools can generate hundreds of optimized variations daily. This ensures your ads stay relevant as audience behavior evolves, ultimately enhancing your campaign’s overall performance.
10. Frequency
Frequency measures how often the average user sees your Meta ad. While some repetition can reinforce your message, too much can lead to ad fatigue, where users lose interest and engagement drops. For instance, if your ad gets 1,000 impressions and reaches 500 unique users, the frequency would be 2.0.
Impact on Ad Performance and ROI
When frequency climbs too high, it can hurt your campaign’s return on investment. Seeing the same ad repeatedly often leads to lower engagement, reduced click-through rates, and higher costs. Keeping an eye on this metric is crucial to avoid overexposing your audience.
| Frequency Range | Performance Impact | Recommended Action |
|---|---|---|
| 1.0 - 2.0 | Strong engagement with optimal results | Stick with your current approach |
| 2.0 - 3.0 | Still performing well; monitor closely | Refresh ad creatives if needed |
| 3.0+ | Risk of ad fatigue and declining results | Broaden your audience or update creatives |
Relevance to Meta Ad Delivery Optimization
Frequency plays a big role in how Meta's ad delivery system works. Meta’s algorithm considers frequency when deciding how to deliver your ads. If your frequency is too high, user engagement may drop, which can lower your ad’s priority in the delivery system. Keeping frequency balanced ensures your ads stay effective and maintain good visibility.
Actionability for Marketers
Managing frequency isn’t just important - it’s actionable. Use tools like Meta Ads Manager to set automated rules for frequency caps and rotate your ad creatives regularly to keep things fresh. Expanding your audience with broader targeting options can also help reduce overexposure. If some campaigns show high frequency, shift part of the budget to campaigns targeting new audiences.
Using AI-Powered Tools to Address Frequency Challenges
AI tools like ADEN'S LAB can make managing frequency much easier. These platforms automate creative generation and rotation, producing hundreds of ad variations daily. By constantly refreshing your ads, you can maintain an effective frequency and reach a wider audience. Plus, AI tools test multiple ad variations automatically, helping you optimize campaigns for better engagement and stronger results.
Performance Metrics Comparison Table
Here's a breakdown of key Meta ad metrics compared to industry benchmarks, along with strategies to fine-tune your campaigns. These benchmarks provide clear targets and actionable steps to improve your ad performance.
| Metric | Good Benchmark | Average Benchmark | Poor Benchmark | Primary Optimization Strategy |
|---|---|---|---|---|
| Click-Through Rate (CTR) | 2.0%+ | 1.0% - 2.0% | Below 1.0% | Update ad creatives and refine targeting |
| Cost Per Click (CPC) | $0.50 - $1.00 | $1.00 - $2.00 | Above $2.00 | Adjust audience targeting and boost ad relevance |
| Conversion Rate | 5.0%+ | 2.0% - 5.0% | Below 2.0% | Enhance landing page experience and audience alignment |
| Cost Per Thousand Impressions (CPM) | $5.00 - $10.00 | $10.00 - $15.00 | Above $15.00 | Expand audience size and improve ad quality score |
| Return on Ad Spend (ROAS) | 4:1+ | 2:1 - 4:1 | Below 2:1 | Prioritize high-performing audiences and products |
| Ad Relevance Score | 8-10 | 6-7 | Below 6 | Tailor ad content to better match audience interests |
| Engagement Rate | 3.0%+ | 1.5% - 3.0% | Below 1.5% | Focus on creating visually appealing and engaging content |
| Frequency | 1.0 - 2.0 | 2.0 - 3.0 | Above 3.0 | Rotate ad creatives and expand targeting options |
It’s important to note that benchmarks can vary depending on the industry and season. For instance, e-commerce campaigns often experience lower CTRs but higher conversion rates, whereas B2B campaigns may show the opposite trend.
By monitoring these metrics together, you can uncover performance patterns. For example, a high CTR but low conversion rate might point to issues with your landing page, while a low CTR paired with high conversion rates could suggest overly narrow targeting.
To streamline optimization, tools like ADEN'S LAB can test dozens of creative variations in a fraction of the time it would take manually. This allows for continuous improvement across metrics like CTR, engagement, and frequency by refreshing creatives and testing more variations rapidly. Regularly aligning these benchmarks with your metric tracking ensures your campaign strategy stays sharp and effective.
Conclusion
Keeping an eye on the right metrics is crucial for success in Meta ad campaigns. Without tracking key indicators like CTR, CPC, and conversion rates, you're essentially navigating your advertising efforts without a map. These metrics don’t just inform your strategy - they also highlight when it’s time to adjust and refine your campaigns.
The best marketers don’t stop at tracking - they act. By consistently monitoring frequency to avoid ad fatigue, optimizing CPM through precise targeting, and ensuring high relevance scores, you can create a competitive edge that fuels long-term growth.
That said, managing and optimizing multiple campaigns manually can quickly feel overwhelming. This is where AI-powered platforms step in to revolutionize the process for today’s marketers.
Automation simplifies everything. Platforms like ADEN'S LAB take Meta ad optimization to the next level by automating creative testing, which directly impacts your key metrics. With the ability to generate hundreds of ad variations daily, you can test and iterate 10x faster than traditional methods.
This rapid testing approach uncovers top-performing ads faster, improving metrics like CTR and ROAS. Instead of just monitoring your data, you’re actively enhancing it through continuous optimization.
By focusing on these 10 key metrics, you’re not just improving your current campaigns - you’re laying the groundwork for sustained success. For brands looking to excel in Meta advertising, combining precise metric tracking with AI-driven creative solutions creates a powerful growth engine. You’ll gain actionable insights from your data and have the tools to act on them immediately.
The brands that dominate Meta advertising are the ones that master both the analytics and the agility to iterate quickly. Start tracking these metrics consistently, and pair them with the right tools to transform insights into scalable success that leaves competitors behind.
FAQs
How can ADEN'S LAB help me improve the performance of my Meta ad campaigns?
ADEN'S LAB takes your Meta ad campaigns to the next level by automating the creation of high-quality, data-driven ads that truly connect with your target audience. This means you can test and fine-tune campaigns at lightning speed, identifying the best-performing ads up to 10 times faster.
By generating hundreds of ads daily, ADEN'S LAB removes the need for tedious manual work and cuts down on the high costs usually tied to ad production. This streamlined approach allows you to focus on scaling your campaigns, boosting ad performance, and achieving higher conversion rates - all while saving valuable time and money.
How can I tell if my Meta ad frequency is too high, and what steps can I take to fix it?
If your Meta ad frequency climbs too high, you might start seeing lower click-through rates, audience fatigue, or even negative feedback. Another red flag? A rising frequency metric, which means your audience is being shown the same ad too often.
Here’s how you can address this issue:
- Set frequency caps: Limit how many times your ads are shown to the same users.
- Switch up your creatives: Regularly update your ad designs and messaging to keep things fresh.
- Revisit your budget or targeting: Adjust these to prevent overexposure to a single audience.
- Broaden your audience: Reach more people to reduce repetitive views for the same group.
Keeping an eye on your performance metrics and tweaking your strategy can help you hold your audience’s attention and get better results from your ads.
Why is the Ad Relevance Score important for Meta ads, and how can I improve it?
The Ad Relevance Score is a crucial factor in determining how well your Meta ads perform. Essentially, it measures how effectively your ad connects with your target audience. Ads with higher relevance scores not only tend to deliver better results but also come with perks like lower costs and greater visibility.
Want to improve your score? Start by crafting ads that are sharply targeted, visually appealing, and directly aligned with your audience's interests. Dive into performance metrics to spot ads that aren't hitting the mark, then tweak them to better match what your audience wants. Ads that resonate and engage are more likely to see higher click-through rates and conversions. This doesn’t just enhance your ROI - it also strengthens your audience's trust in your brand.
Your next ad batch starts here
Finish with a ready-to-test ad batch
Paste your website to generate static creatives. Drop the link → get ads in about 90 seconds → upload them to Meta → scale.
Free to try No prompt writing